A Parent's Guide to Understanding Your Child's Digital Progress Report
That familiar manila envelope arrives, and your heart does a little jump. The school report card. For many parents, it's a moment filled with a mix of hope, anxiety, and a lot of questions. But in today's classrooms, that paper report is quickly being replaced by something far more powerful: the digital progress report.
Instead of a static snapshot, you now have access to a dynamic dashboard filled with charts, percentages, and metrics. This shift from paper to pixel is a huge leap forward for understanding student performance, but it can also feel like learning a new language. This guide is here to be your translator. We'll teach you how to decode this valuable data, understand your child's unique learning journey, and use these insights to foster supportive conversations that build confidence. With tools like TutorAI providing unprecedented clarity, you can become an even more effective partner in your child's education.
Beyond Letter Grades: How to Interpret Your Child's Digital Progress Report
A traditional report card gives you a single data point—a letter grade, which is an average of tests, homework, and participation over several months. A digital progress report, however, offers a moving picture of your child's learning. It shows trends, highlights specific skill mastery, and pinpoints the exact areas where they might be struggling.
Think of it as the difference between a photograph and a video; one is a moment in time, while the other tells the whole story. For instance, a 'B' in math might hide that your child has mastered geometry (95%) but struggles with fractions (65%)—critical information for targeted support.
Let's break down the key components you'll likely see in a modern digital report, using the kinds of analytics found in platforms like TutorAI as concrete examples.
Decoding 'Topic Mastery' and Proficiency Levels
One of the most powerful features of a digital report is the shift from broad subject grades to Topic Mastery. Instead of just seeing a 'B' in Math, you can see that your child has mastered 'Geometric Shapes' but is still developing in 'Linear Equations.'
Proficiency levels (often labeled as 'Beginning,' 'Developing,' 'Proficient,' or 'Mastered') measure deep understanding of a single skill. According to the experts at Vanderbilt University's IRIS Center, this kind of specific progress monitoring is key to making effective instructional decisions. Look for patterns in this data. Is your child consistently excelling in visual-spatial topics like geometry but struggling with abstract concepts in algebra? That's a powerful insight a simple letter grade would never reveal.
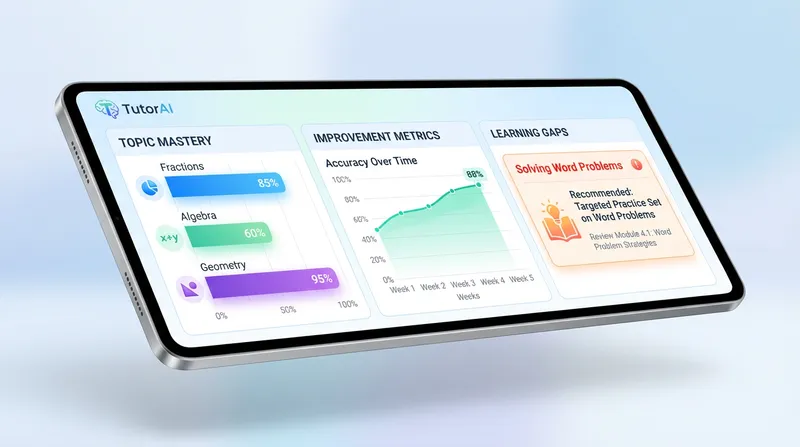
Understanding 'Improvement Metrics' and Tracking Growth
It's natural to focus on the final score, but Improvement Metrics encourage a crucial shift in perspective: from "What is the grade?" to "How much has the grade improved?" This feature tracks progress over time, celebrating effort and persistence—the cornerstones of a healthy growth mindset.
For example, your child's dashboard might show they are still 'Developing' in a difficult topic, but their accuracy has jumped 30% over the last two weeks. That is a huge win worth celebrating! It reframes the conversation around progress, not perfection, and reinforces the idea that hard work pays off. Focusing on growth is one of the most effective study tips for students you can model for your child.
Using Analytics to Pinpoint and Track Learning Gaps
Perhaps the most actionable feature of a digital report is its ability to track learning gaps at home. The granular data helps you and your child identify the exact point where understanding breaks down. A student isn't just 'bad at math'; the data might show a specific, foundational weakness in 'operations with fractional exponents.'
This precision is invaluable. It turns a big, scary, and overwhelming problem ('I'm failing math!') into a small, manageable one ('I need to practice this one skill'). As research from the Harvard Graduate School of Education highlights, parents often see good grades but are unaware of underlying skill gaps that appear later on state tests. Digital analytics close this gap, giving you an early warning system to address minor issues before they become major hurdles.
Pro Tip: When you identify a specific gap, tools like TutorAI let your child practice that exact skill with instant feedback and step-by-step explanations, turning a moment of struggle into a learning opportunity.
From Data to Dialogue: Fostering Positive Conversations About School Performance
Let's be honest: talking about grades and school reports can be stressful for everyone involved. The key to changing this dynamic is to use the data as a tool for partnership, not a weapon for judgment. When you approach the conversation with empathy and a collaborative spirit, you can transform it from a tense confrontation into a productive, supportive dialogue.
One parent told us, "Seeing the mastery chart changed everything. Instead of starting with what was wrong, I could say, 'Look at you! 95% in Geometry!' My son's whole body language changed, and he was actually willing to talk about the tougher topics after that."
How to Start the Conversation: Focus on Strengths First
Before you even open the report, the non-profit Understood.org recommends starting by asking your child a simple question: "How do you feel about your progress report?" This invites them into the conversation as an equal partner and shows you value their perspective.
When you do dive into the data, make a point to find specific wins to celebrate first. Instead of immediately honing in on the 65%, start with the 95%.
- Try saying: "Wow, I see your mastery score in 'Chemical Reactions' is at 98%! That's fantastic. You've clearly worked hard on that."
This approach builds trust, boosts their confidence, and makes them far more receptive to discussing areas that need a little more work. It proves you see their effort and success, not just their struggles.
Collaborative Problem-Solving: From 'You Need to Fix This' to 'How Can We Tackle This?'
Once you've established a positive tone, you can address the challenging areas collaboratively. The goal is to shift your language from accusation to teamwork. An evidence-based strategy recommended by the Child Mind Institute involves working together to set clear, achievable goals.
Use the data to prompt collaborative questions:
- "I noticed this topic on solving algebra word problems has been a bit tricky. What about it feels tough?"
- "What kind of support would be most helpful for you here? More practice time? Or maybe a different way of looking at it?"
- "Let's set a goal together. How about we aim to raise this score by 10% before the next check-in? How can I help you do that?"
This approach positions you as a supportive coach, not a critic. It tells your child, "We are on the same team, and we'll figure this out together."
Partnering with Teachers: Using Digital Insights for Productive Communication
Your child's digital report is also a powerful tool for improving parent-teacher communication. As the educational foundation Edutopia notes, effective parent-teacher relationships are built on two-way communication where parents are seen as partners. Walking into a conference armed with specific data completely transforms the conversation from generic to productive.
Smarter Questions to Ask Your Child's Teacher
Instead of asking broad questions that are hard to answer, use the data to ask specific, informed ones. This shows the teacher you are engaged and allows them to provide much more targeted feedback. Research from the U.S. Department of Education (ERIC) confirms that clear, useful communication fosters better monitoring of student progress.
Instead of asking this:
- "How is my child doing in math?"
Try asking these data-driven questions:
- "The progress report shows a dip in 'Trigonometric Functions' over the last two weeks. Was there a new concept introduced that might be the cause?"
- "I see my child's effort metrics are high, but their mastery is still developing in this area. What strategies can we use at home to reinforce what you're teaching?"
- "The data shows a consistent struggle with multi-step problems. Do you have any resources or homework help strategies you'd recommend for that specific skill?"
Your Action Plan: How to Support Your Child's Learning Journey at Home
Understanding the data is the first step. The next is turning those insights into action. This is where you can truly leverage the power of digital reports to provide targeted support right at home. And it's where modern digital tools can make all the difference.
Using TutorAI to Address Learning Gaps and Build Mastery
Once the digital progress report has helped you identify a specific learning gap, what's next? This is the moment to connect the dots for your child and show them how a tool like TutorAI can help them take control of their own learning.
Did the report show a weakness in a specific topic? You can guide your child to that exact subject in the app for targeted practice. TutorAI's "Snap. Solve. Learn." process empowers students to get unstuck on their own terms. They can snap a photo of a difficult problem, receive an immediate step-by-step explanation, and truly understand the why behind the answer. This builds the independent AI Tutor study skills and confidence they need to succeed.
Conclusion: From Data Overload to Empowered Parent
Your child's digital progress report isn't just another set of grades to worry about—it's a roadmap. It's your ally in understanding their academic journey in a way that was never before possible. By learning to decode this data, you can spot weaknesses before they become roadblocks, celebrate every bit of progress, have more supportive and less stressful conversations, and become an even more effective partner for both your child and their teacher.
This data empowers you to move from worrying to acting. You can now provide the precise support your child needs, exactly when they need it.
Ready to turn your child's progress insights into action? TutorAI's photo-based problem solving and detailed progress tracking give you both the clarity and 24/7 support you need to champion their learning journey. Download it free on iOS and Android today!
Frequently Asked Questions
What's the real difference between proficiency levels and a traditional letter grade?
A traditional letter grade, like a B, is an average of many different skills and assignments. It can hide both strengths and weaknesses. Proficiency levels are much more specific. A student might have a B in math overall, but a digital report can show they are 'Mastered' in geometry while still 'Beginning' in fractions. This specific insight allows you to focus support exactly where it's needed.
My child gets defensive when I bring up their progress report. What can I do?
This is a very common challenge. The best approach is to start the conversation by asking how they feel about it first. Then, as recommended by parenting experts, focus on their strengths before discussing areas for improvement. Use collaborative "we" language (e.g., "How can we tackle this together?") to create a sense of teamwork rather than confrontation.
How often should I check my child's digital progress report?
We recommend finding a consistent but not obsessive schedule, like checking in once a week. A Sunday evening review, for example, can be a calm, low-stress way to stay informed and spot trends without making your child feel like they are being micromanaged. The goal is to be an informed supporter, not a constant monitor.
My child's grades are good, but the data shows some learning gaps. Should I be concerned?
You shouldn't be concerned, you should be empowered! This is one of the biggest benefits of digital reports. As researchers at Harvard have noted, good grades can often mask underlying skill gaps. Identifying these gaps early gives you a fantastic opportunity for low-stakes intervention to reinforce foundational skills before they impact a future grade.
What if I don't understand the data on the report myself?
That's perfectly okay—this is a new skill for many parents. First, use guides like this one to familiarize yourself with the terms. Second, don't be afraid to ask the teacher for help. Approaching a teacher with a question like, "Can you help me understand what this 'proficiency metric' means and how I can best support it at home?" shows you're an engaged partner in your child's education.


